Field Notes on Scaling MoE Expert Parallelism with DeepEP
This post is a peek into the process of getting expert parallelism to scale for MoE training. Kernel-level debugging sessions, surprising bottlenecks, and 2 AM fixes don't usually make it into polished papers. We're sharing them here because we think the process of building at scale is equally valuable as the final results.
Our training stack is a heavily modified version of Torchtitan. After evaluating multiple pre-training frameworks in early 2025 we decided to centralize our efforts around Torchtitan as it provided a straightforward path to accessing the latest features from the PyTorch team.
While Torchtitan has been an enormous success for us, the upstream version has been largely conservative with the velocity of changes and integration of more bespoke features. Among the features we've integrated over the past year are variable length masked training (used for Hermes 4), asynchronous reinforcement learning with Atropos (see NousCoder), the Muon optimizer, LoRA support, inline downstream evaluations, and a host of new model architectures and processed data formats.
While some of these features later were formalized in upstream Torchtitan, we've found we simply have to move at a quicker pace. This is understandable though, as upstream Torchtitan needs to work for all use cases – our fork just needs to work for us. It's a credit to the architecture and design decisions made by the Torchtitan team that we've been able to make such extensive changes while minimizing merge conflicts. Compounding our issues was that, like the Upstage Solar team noted in the Solar Open report, we took early delivery of a B200 cluster before the PyTorch and Triton ecosystem was fully developed to support Blackwell which led to many early frustrations.
When we turned our focus towards MoE training we noted that DeepEP had been a key component of DeepSeek-V3's training efficiency. At the time the expert parallelism path was highly unoptimized in Torchtitan, so we took on integrating DeepEP into the codebase. It is here our story begins.
November 14 - Scaling Expert Parallelism Linearly
We started with a problem that looked simple on paper: scale expert parallelism across nodes. That turned out not to be so simple.
Problem 1: Intranode kernels scale poorly with expert parallelism
Our first clue that something was wrong came from the throughput numbers. When we increased expert
parallelism (EP), performance didn't scale the way we expected. We dug into the Nsight profiler reports
to understand why, and that's when we spotted the culprit: DeepEP's intranode kernels, especially
cached_notify_combine, were scaling terribly with EP. So we started tuning the number of
SMs (num_sms) allocated to DeepEP.
Here is what the Nsight report showed us for EP=2 and EP=4. The top-15 slowest kernels made it clear:
DeepEP intranode kernels were dominating GPU time. The worst offender:
deep_ep::intranode::cached_notify_combine(int).
EP=4 - Top 15 Kernels
void deep_ep::intranode::cached_notify_combine<(int)4> void **, int *,     54.306s  ( 38.1%)
ncc!DevKernel_AllGather_RING_LL`ncc!DevKernelArgsStorage< unsigned lon     17.169s  ( 12.1%)
void deep_ep::intranode::dispatch<(int)4, (int)768, (int)8192> int4 *,      9.107s  (  6.4%)
void deep_ep::intranode::combine<__nv_bfloat16, (int)4, (int)768, (int      8.539s  (  6.0%)
void at::native::indexFuncLargeIndex<c10::BFloat16, long, unsigned int      4.289s  (  3.0%)
void cutlass::device_kernel<at::cuda::detail::enable_3x_kernel_for_sm1      3.930s  (  2.8%)
void at::native::_scatter_gather_elementwise_kernel<(int)128, (int)8,       3.583s  (  2.5%)
cudnn_generated_fort_native_sdpa_sm100_flash_bprop_f16_knob_3i_128x128       2.811s  (  2.0%)
ncc!DevKernel_ReduceScatter_Sum_T32_RING_LL`ncc!DevKernelArgsStorage<       2.559s  (  1.8%)
void at::native::elementwise_kernel<(int)128, (int)4, void at::native:      2.504s  (  1.8%)
void at::native::<unnamed>::multi_tensor_apply_kernel<at::native::<unn      2.246s  (  1.6%)
void deep_ep::intranode::cached_notify_dispatch<(int)4> const int *, i      2.226s  (  1.6%)
void cutlass::device_kernel<at::cuda::detail::enable_3x_kernel_for_sm1      2.045s  (  1.4%)
void at::native::<unnamed>::vectorized_layer_norm_kernel<c10::BFloat16       1.943s  (  1.4%)
void cutlass::device_kernel<at::cuda::detail::enable_3x_kernel_for_sm1      1.940s  (  1.4%)
EP=2 - Top 15 Kernels
ncc!DevKernel_AllGather_RING_LL`ncc!DevKernelArgsStorage< unsigned lon     31.187s  ( 30.5%)
void deep_ep::intranode::cached_notify_combine<(int)2> void **, int *,     19.856s  ( 19.4%)
ncc!DevKernel_ReduceScatter_Sum_T32_RING_LL`ncc!DevKernelArgsStorage<       6.529s  (  6.4%)
void deep_ep::intranode::combine<__nv_bfloat16, (int)2, (int)768, (int      5.060s  (  5.0%)
void deep_ep::intranode::dispatch<(int)2, (int)768, (int)8192> int4 *,      3.468s  (  3.4%)
cudnn_generated_fort_native_sdpa_sm100_flash_bprop_f16_knob_3i_128x128       2.406s  (  2.4%)
void at::native::elementwise_kernel<(int)128, (int)4, void at::native:      2.064s  (  2.0%)
void at::native::_scatter_gather_elementwise_kernel<(int)128, (int)8,       1.843s  (  1.8%)
void at::native::<unnamed>::multi_tensor_apply_kernel<at::native::<unn      1.776s  (  1.7%)
void at::native::indexFuncLargeIndex<c10::BFloat16, long, unsigned int      1.742s  (  1.7%)
void cutlass::device_kernel<at::cuda::detail::enable_3x_kernel_for_sm1      1.696s  (  1.7%)
void at::native::<unnamed>::vectorized_layer_norm_kernel<c10::BFloat16       1.681s  (  1.6%)
cudnn_generated_fort_native_sdpa_sm100_flash_fprop_f16_knob_7_128x128x       1.602s  (  1.6%)
void at::native::detail::chunk_cat_cuda_kernel<float, c10::BFloat16>::T      1.441s  (  1.4%)
void deep_ep::intranode::cached_notify_dispatch<(int)2> const int *, i      1.397s  (  1.4%)
EP = 4: cached_notify_combine = 54.306 s (approximately
38.1% of GPU time)
EP = 2: cached_notify_combine = 19.856 s (approximately
19.4% of GPU time)
Result: 2.73x slowdown in that kernel when doubling expert
parallelism.
And it wasn't just that one kernel. The other DeepEP intranode kernels were showing the same pattern:
dispatch<int4>: 9.107 s vs dispatch<int2>:
3.468 s → 2.63x slower
combine<int4>: 8.539 s vs combine<int2>:
5.060 s → 1.69x slower
At the system level: EP=4 was 42.7% slower than EP=2 (4624 vs 6599 tokens/sec), far from a rounding error.
We traced it to the kernel launch configuration. Looking at csrc/kernels/intranode.cu:613-628: the kernel launches with 1 + num_channels blocks, and each block processes all ranks, assigning one warp per rank. Double EP, double the work per block, but no additional parallelism.
That explained the ~2.7x slowdown. Now we knew what to fix.
After solving Problem 2 (below) to make num_sms tunable, we swept SM counts and found a much
better configuration:
num_sms = 128 (up from 24)
Dispatch Config:
turbo_deepep_num_cus              = 128
turbo_deepep_dispatch_tuned_config = (32, 1024, 8, 128)
Performance                        = 122.32 μs, 496.28 GB/s
Combine Config:
turbo_deepep_combine_tuned_config = (16, 256, 8, 128)
Performance                       = 127.43 μs, 476.36 GB/s
Performance Improvements
Comparison vs Current Baseline (num_sms=24):
Dispatch:    56.3% faster  (279.69 μs  → 122.32 μs)
Combine:     61.8% faster  (333.95 μs  → 127.43 μs)
Bandwidth:   2.28x higher for dispatch (217.90 GB/s → 496.28 GB/s)
Bandwidth:   2.61x higher for combine  (182.49 GB/s → 476.36 GB/s)
Comparison vs Worst (num_sms=8):
Dispatch:  83.0% faster  (721.57 μs → 122.32 μs)
Combine:   84.0% faster  (794.58 μs → 127.43 μs)
Problem 2: The tuner that wouldn't tune
We knew num_sms was the lever. But when we tried to sweep different values, DeepEP's
benchmarking code crashed every time. The tuner assumed a single fixed num_sms, and if you
changed it mid-run you would hit an assertion failure.
We traced it to csrc/config.hpp:61:
const int num_channels = num_sms / 2; // KEY: derived from num_smsThis breaks when you try to vary num_sms.
• Initial run (baseline config): num_sms = 24 → num_channels = 24 / 2 = 12
• Cached matrix shape becomes [4, 12] for a 4-rank setup.
• Later run in the same process, trying to test:
num_sms = 32 → expects num_channels = 32 / 2 = 16
• DeepEP checks the cached matrix via an assertion in deep_ep.cpp:403:
cached_matrix->size(1) == num_channels
• But the matrix is still [4, 12], so: Expected: 16, Actual: 12
The root cause was that the Buffer's cached routing metadata is intrinsically tied to
num_sms, but the code treats it as if it were reusable across configurations.
To unblock our tuning, we changed the intranode benchmarking flow to create a separate Buffer instance
for each num_sms value in the sweep. Simple enough fix once we understood the issue.
Where we landed: Our current EP runs achieve about 57% of the theoretical limit, while DeepEP's baseline reaches about 34% of the theoretical limit on their hardware. We'll take that improvement.
DeepEP's Reference Squeeze (H800)
Theoretical:  450 GB/s
Achieved:     153 GB/s
Squeezed:     34.0% of hardware capability
Our Squeeze (B200)
Theoretical:  900 GB/s
Achieved:     516.71 GB/s
Squeezed:     57.4% of hardware capability
November 18 - Identifying the Next Bottleneck: CPU Launch Overhead
With near-linear scaling across nodes finally working, we shifted focus to squeezing more out of each training step. We ran profiling on the end-to-end step and spotted where the time was going.
#1. ScatterAddBackward0
CPU Boundary Time:   4.32s  (36.26% of total)
GPU Kernel Time:     1.13s  (26.16% of CPU time)
CPU Overhead:        3.19s  (73.84% of CPU time)
Primary Kernel:
void at::native::indexFuncLargeIndex<c10::BFloat16, long, unsigned int, 2,
  GPU Time: 419.0ms (96 invocations, avg 4364.7μs)
Associated Kernels (12 total):
• void at::native::indexFuncLargeIndex<c10::BFloat16, long, unsigned int, 2, 2, -2, true
• void at::native::_scatter_gather_elementwise_kernel<128, 8, at::native::_cuda_scatter_
• void at::native::vectorized_gather_kernel<16, long>(char*, char*, long*, int, long, lo
• ncc!DevKernel_AllGather_RING_LL(ncc!DevKernelArgsStorage<4096Ul>): 110.8ms (198 calls)
• void at::native::sbtopk::gatherTopK<float, unsigned int, 2, false>(at::cuda::detail::T
• ... and 7 more
#2. FusedDispatch
CPU Boundary Time:   2.12s    (17.77% of total)
GPU Kernel Time:     309.3ms  (14.61% of CPU time)
CPU Overhead:        1.81s    (85.39% of CPU time)
Primary Kernel:
void deep_ep::intranode::dispatch<8, 768, 8192>(int4*, float*, int*, long*,
  GPU Time: 95.2ms (288 invocations, avg 330.4μs)
Associated Kernels (9 total):
• void deep_ep::intranode::dispatch<8, 768, 8192>(int4*, float*, int*, long*, float*, int*
• void at::native::(anonymous namespace)::multi_tensor_apply_kernel<at::native::(anonymous
• void deep_ep::layout::get_dispatch_layout<256, 4, 8>(long const*, int*, int*, int*, bool
• void deep_ep::intranode::notify_dispatch<8>(int const*, int*, int const*, int*, int, int
• void deep_ep::intranode::cached_notify_dispatch<8>(int const*, int, void**, int**, int):
• ... and 4 more
These two ops account for 36% + 17% = ~53% of the total end-to-end step time. And most of that isn't even GPU compute, it's CPU-side dispatch and launch overhead (all numbers are per-step CPU boundary time).
Sanity check: To confirm this was really the bottleneck, we temporarily commented out the single scatter_add line [link]. With everything else unchanged, throughput jumped to ~21k (30% improvement) and we hit ~500 tflop/s. That was pretty clear confirmation that this was our next real bottleneck.
Summary statistics of all operations
Total CPU Boundary Time:  11.91s
Total GPU Kernel Time:    31.32s  (262.9% of CPU time)
Total CPU Overhead:        8.99s  (75.4% of CPU time)
Total Operations:            153
November 24 - Scaling Results
We benchmarked scaling behavior on Qwen3-30B-A3B (128 experts, top-k=8):
Scaling Results: Qwen3-30B (128 experts, top-k=8)
Strong Scaling (fixed batch size, increasing nodes):
| Configuration | Nodes | GPUs | Tokens/sec | TFLOPS | Memory/GPU |
|---|---|---|---|---|---|
| 1 node | 1 | 8 | 14,796 | 341 | 167.93 GiB (94.15%) |
| 2 nodes | 2 | 16 | 14,380 | 331 | 138.75 GiB (77.78%) |
| 4 nodes | 4 | 32 | 14,276 | 329 | 124.58 GiB (69.84%) |
| 8 nodes | 8 | 64 | 14,107 | 325 | 117.50 GiB (65.88%) |
| 16 nodes | 16 | 128 | 13,856 | 319 | 114.78 GiB (64.35%) |
Weak Scaling (optimized batch size for 16 nodes):
| LBS | Nodes | GPUs | Tokens/sec | TFLOPS | Memory/GPU |
|---|---|---|---|---|---|
| 8 | 16 | 128 | 13,856 | 319 | 114.78 GiB (64.35%) |
| 10 | 16 | 128 | 14,123 | 326 | 142.21 GiB (79.73%) |
With expert parallelism optimized to remain within a single node for the 30B-A3B configuration, throughput scales near-linearly. Any degradation at larger scale would come from non-expert parallelism factors.
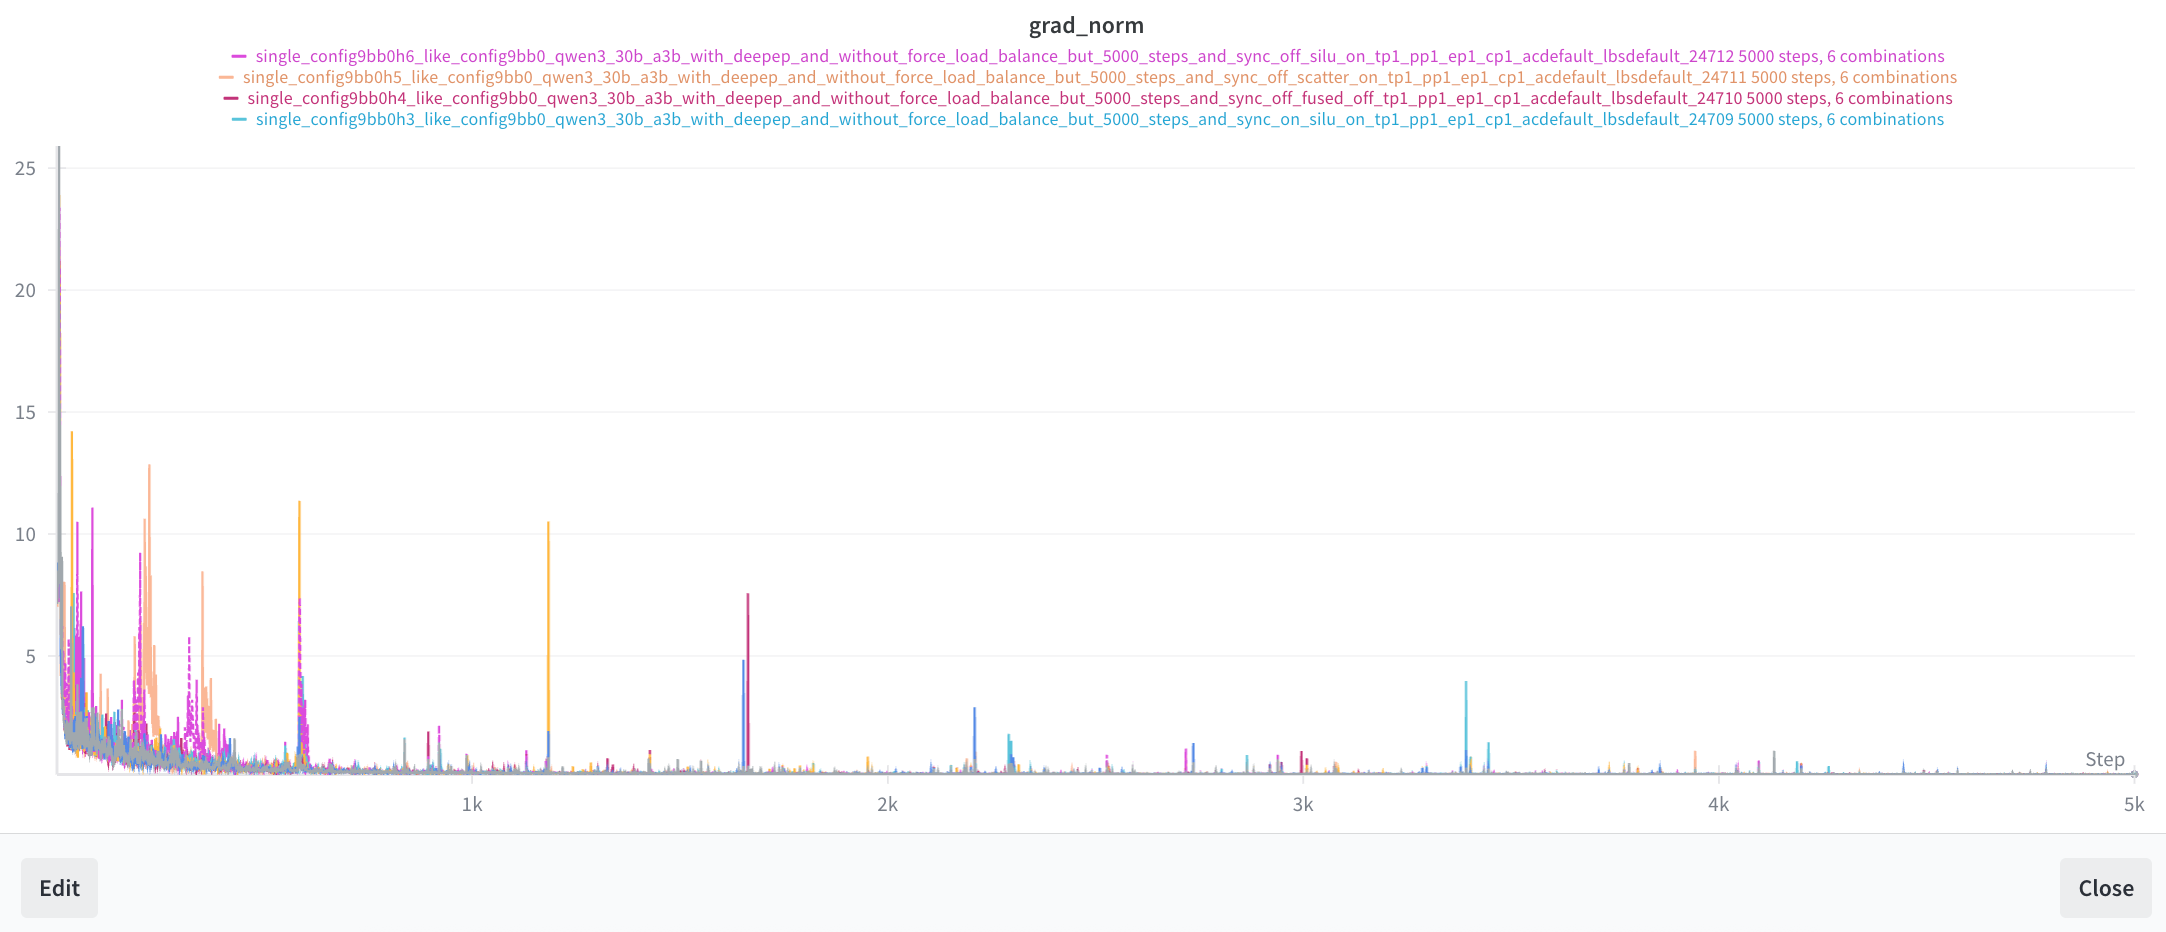
November 25 - Fixing Gradient Norm Explosion in MoE Training
Then we hit a training stability issue that took some detective work to unravel.
Gradient norm was blowing up, and we were seeing a 143,000x imbalance between rank 0 and ranks 1-7. We traced backwards through the routing logic to figure out what was happening with token distribution.
Token Distribution - All tokens routing to rank 0
tokens_per_dest_rank:  [524288, 0, 0, 0, 0, 0, 0, 0]
expert_idx:            min=0, max=7, mean=3.5
All 8 ranks sending 100% of their tokens to rank 0. With 128 experts across EP=8, each rank should receive somewhere around 524288/128/8 tokens.
So we dug into the router output to understand what was going on:
Router Scores - All zeros
scores.shape:  (8192, 128)               # looks right
scores:        mean=0, std=0, min=0, max=0  # all zeros
The router computes scores = gate(x) where gate is a linear projection (128, 2048). If scores are all zero, then topk(scores, k=8) has to break ties, and PyTorch just returns the first k indices [0,1,2,3,4,5,6,7]. That's why everything was going to rank 0.
But why were all the scores zero? We kept digging into the gate weights and input activations:
Root Cause - Gate weights initialized to zeros
input x:      (8192, 2048), mean=0.005, std=1.0, range [-5, 5.4]  # fine
gate.weight:  (128, 2048),  mean=0, std=0                         # zeros
Input activations look healthy (normalized,
no nan/inf). But notice gate weight is entirely zeros - and recall scores = x @ W.T, so
with W=0 we get zero scores regardless of input. That's the cause.
December 2 - Grad Norm Issue Due to torch._grouped_gemm Bug
A week later, we hit another gradient issue. This time the culprit was deeper:
torch._grouped_mm backward pass produces garbage gradients when an expert has 0 tokens.
The Problem
When force load balancing is disabled (meaning
the router is trained from scratch), some experts receive no tokens at the beginning. Those experts
should have zero gradients. But for this to work properly, torch._grouped_mm expects
experts with 0 token count to be padded up to 8. That's an odd requirement, and ideally it shouldn't
be necessary, but it is.
The Fix
We added extra padding for experts with zero tokens to 8, ensuring the kernel produces correct gradients during backward pass.
Torchtitan already has a workaround
for this by using clamp_min set to 8 [link]. This technically produces incorrect
gradients if the router happens to route exactly 8 tokens to an expert. But in practice, with at
least 2M tokens in total, the probability of routing exactly 8 tokens is vanishingly small. Still,
it's technically a bug originating from torch._grouped_mm.
Verification
To make sure our fix was correct, we compared the commit state before our DeepEP PR with the PR applied. Loss curves and grad norms now matched ✓
| EP = 1 DeepEP PR Reference |
EP = 8 (No DeepEP) | EP = 8 (With DeepEP) | |||
|---|---|---|---|---|---|
| DeepEP PR | Reference | DeepEP PR | |||
| Force Load Balance = ❌ | |||||
| Loss | 7.55 | 7.57 | 7.54 | 7.61 | 7.52 |
| Grad Norm | 1.65 | 1.83 | 1.33 | 1.54 | 1.01 |
| Force Load Balance = ✓ | |||||
| Loss | 7.70 | ❌ OOM | 7.79 | 7.97 | 7.69 |
| Grad Norm | 0.84 | - | 1.70 | 1.52 | 0.70 |
Note: Everything is identical except the commit state, force_load_balance (true or false), and ep_degree (1 or 8). The DeepEP PR with EP=8 matches the reference results.
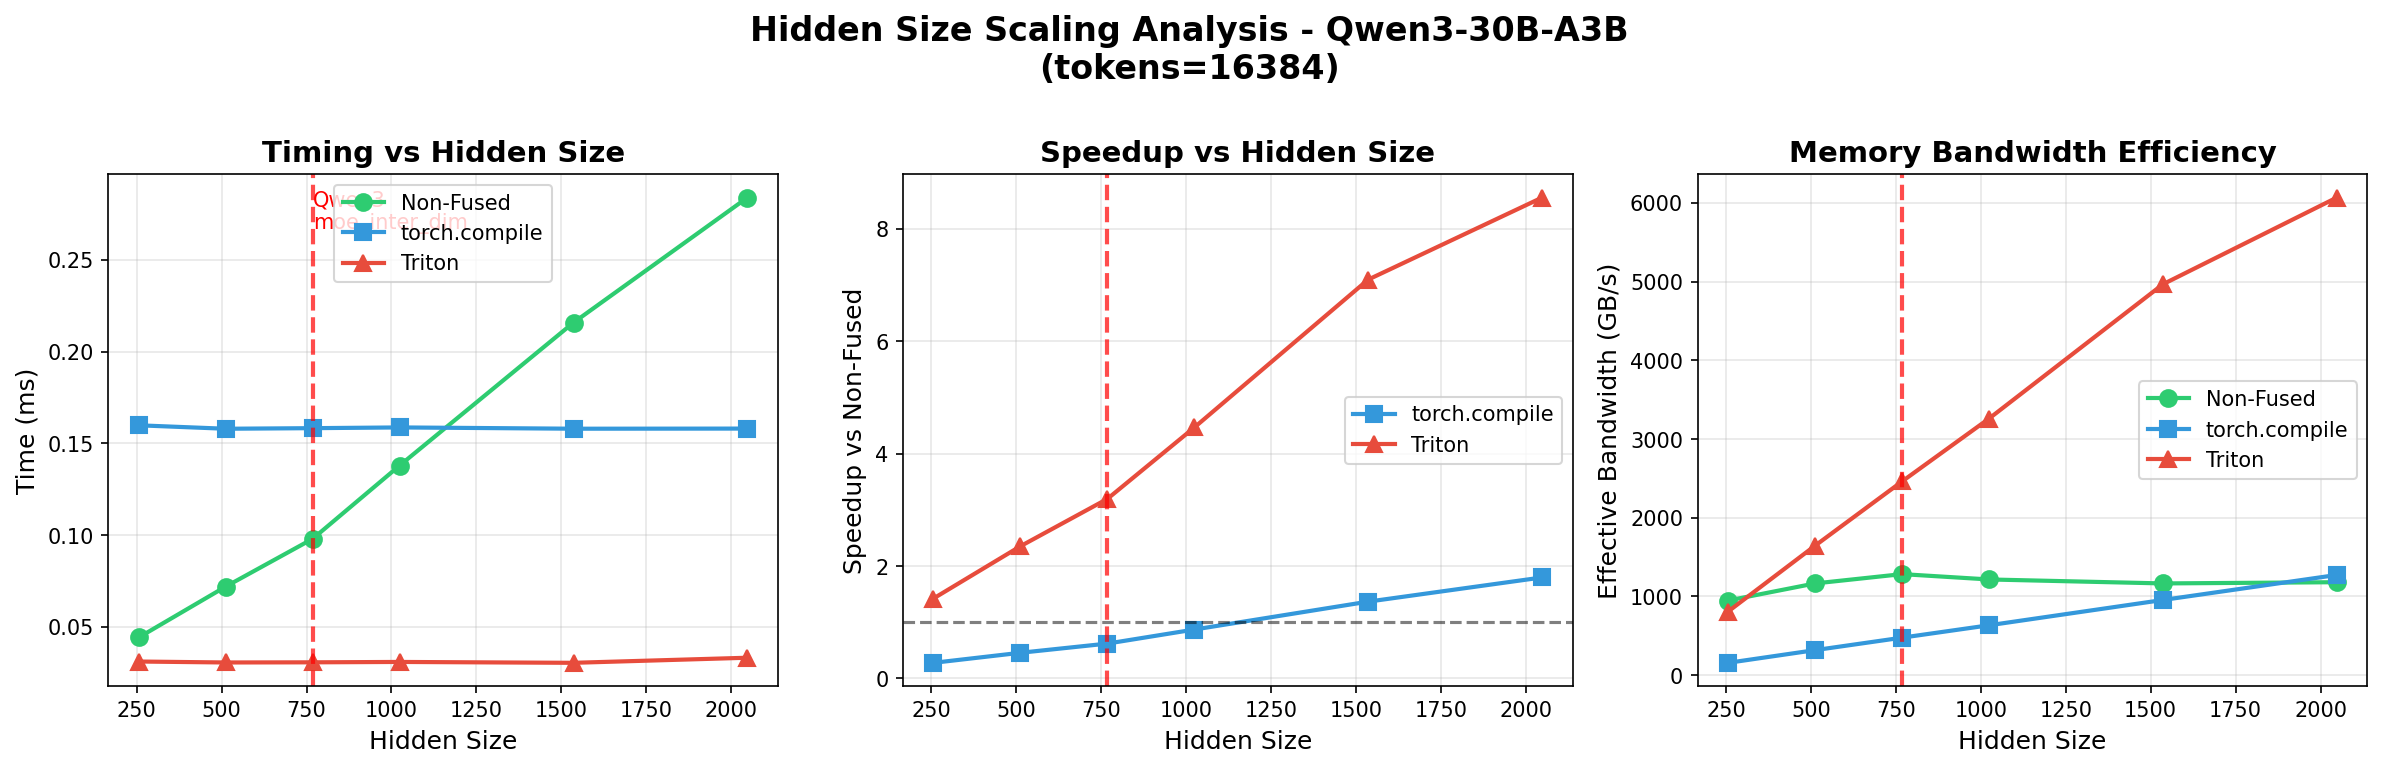
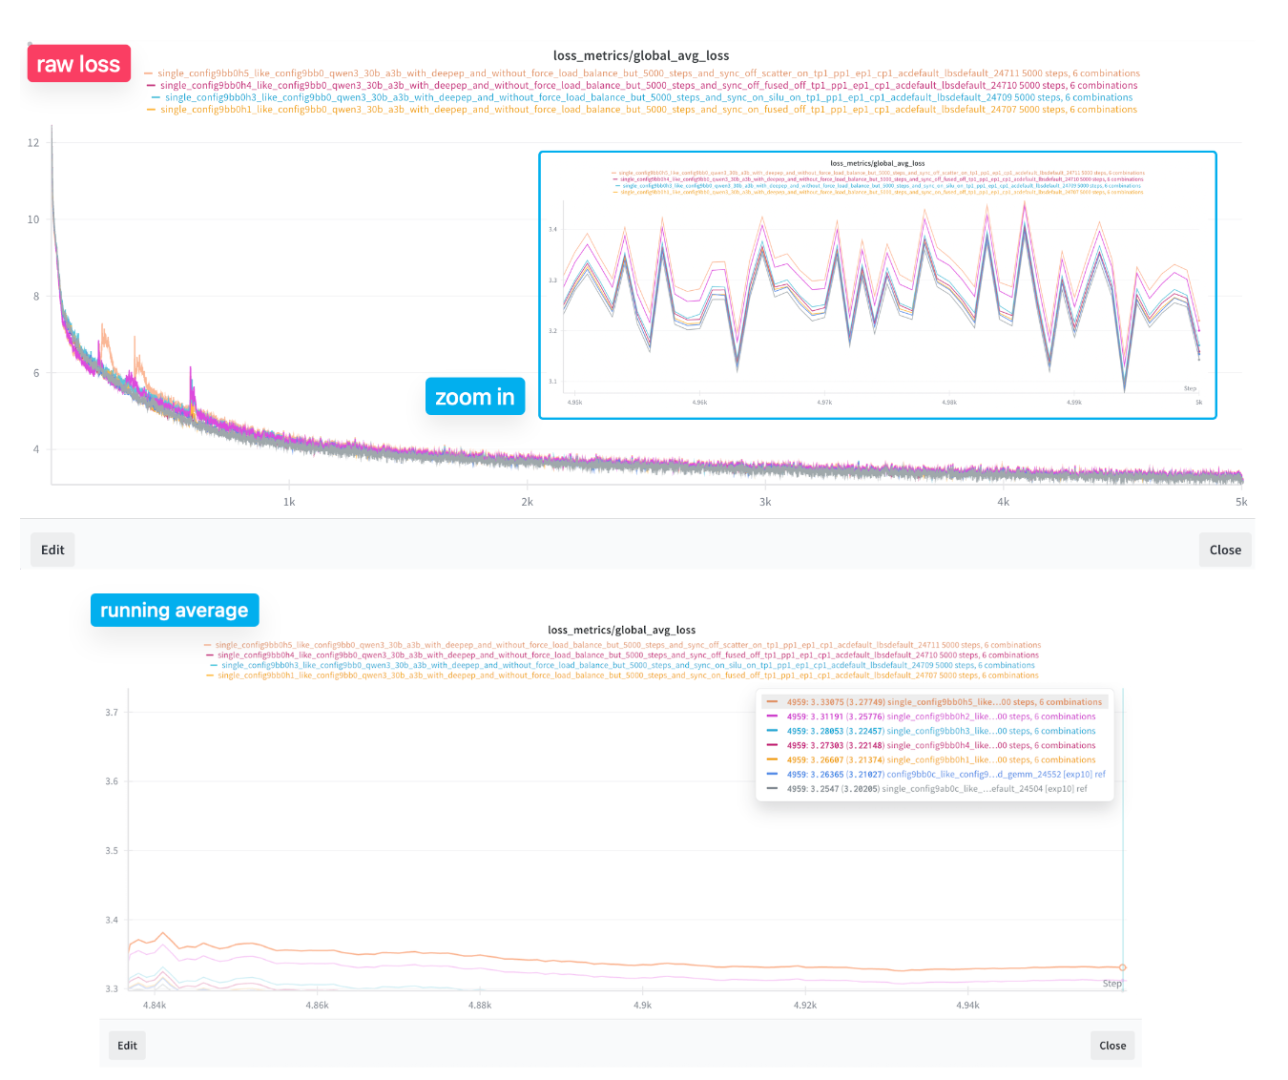
December 5 - Fused Kernel Rounding Mode Differences
We wrote a new fused Triton kernel that combines [SiLU + expert_output * router_prob] and recovered our original end-to-end throughput. Here's how it benchmarked against the original PyTorch SiLU:
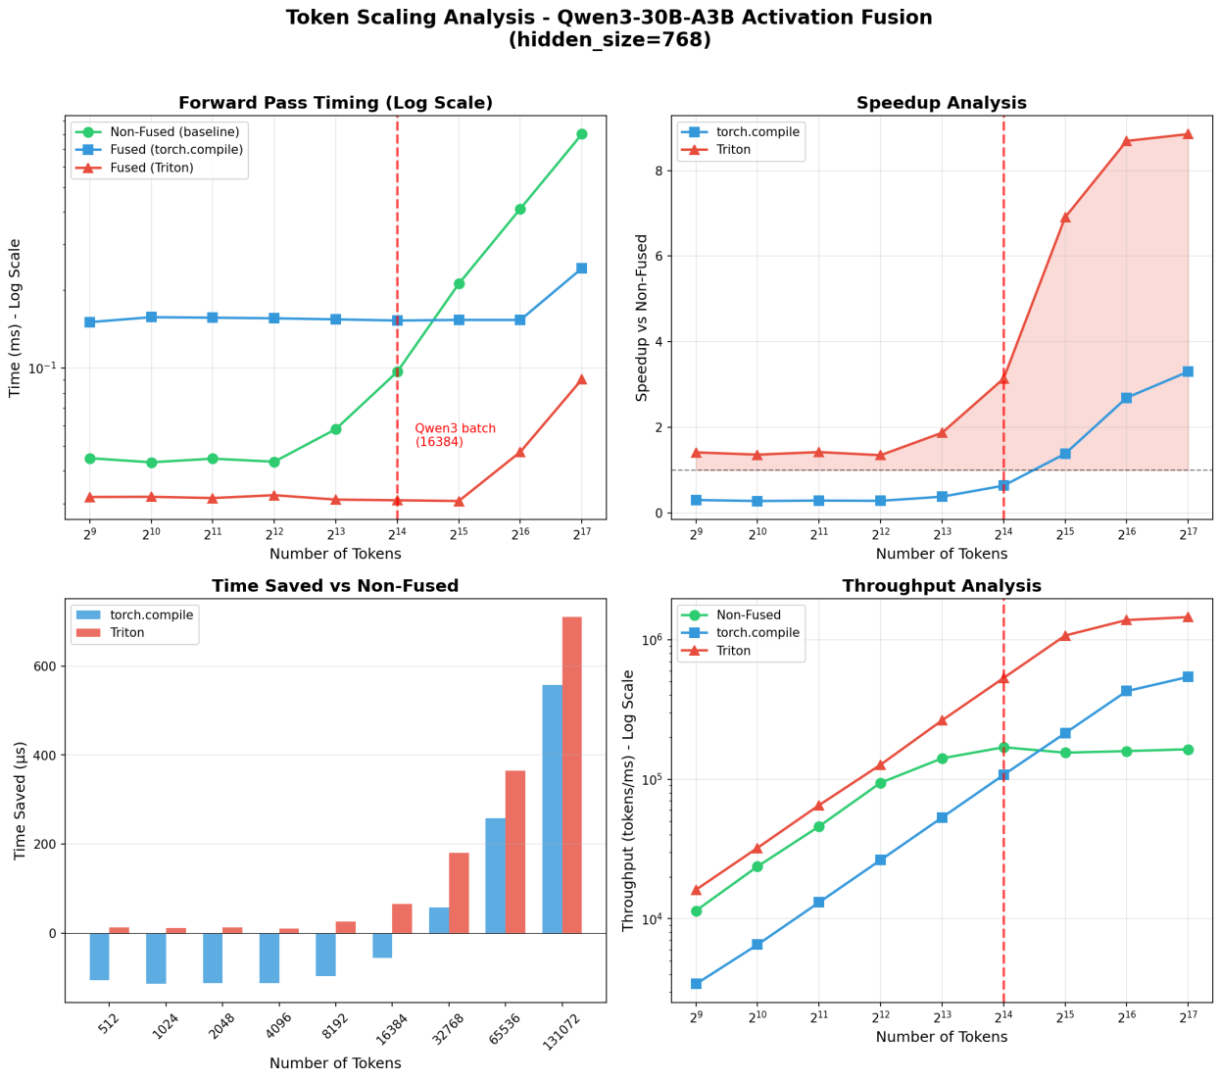
But then we noticed something curious during end-to-end training with the Triton kernel: a small but consistent loss offset, even though there was no grad norm explosion. We traced it to gradient differences caused by accumulation error from Triton's rounding behavior:
The 1-ULP Difference (0.00390625)
What we figured out:
- Triton uses a different rounding mode when casting f32 → bf16.
- PyTorch uses IEEE round-to-nearest-even.
Take the value 0.5683592558: it lies almost exactly between two bf16 values.
- PyTorch rounds it to 0.56640625.
- Triton rounds it to 0.5703125.
Both are technically valid representations (error approximately 0.002). Neither is "wrong."
Root Cause: Probability Scaling Position
After more investigation, we realized the gradient difference came down to where we were applying the probability scaling:
Standard EP:   out = (silu(x@w1) * (x@w3) @ w2).float() * prob          [prob AFTER w2]
DeepEP fused:  out = ((silu(x@w1) * (x@w3)).float() * prob).bf16() @ w2  [prob BEFORE w2]
We tested with float64 and confirmed no difference, proving mathematical equivalence. But in bf16, order of operations matters for numerical precision.
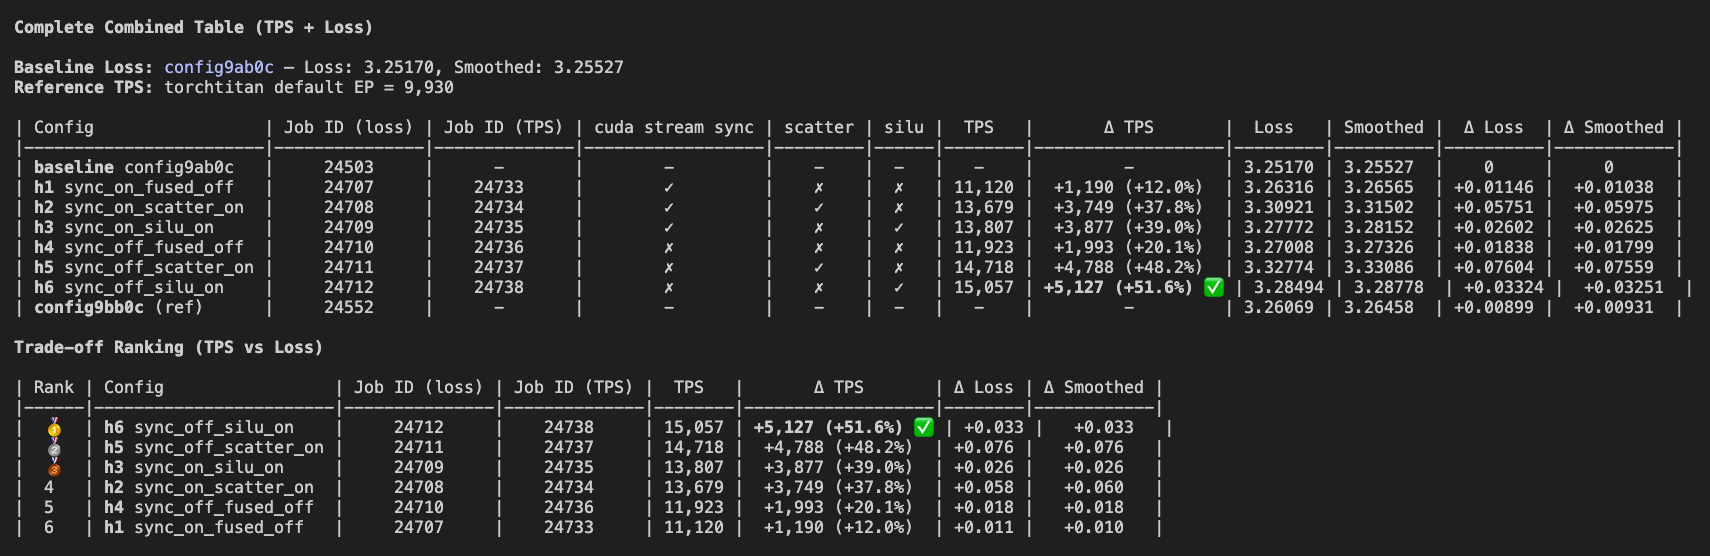
December 9 - Achieving 15,057 TPS with Fused Kernel Optimizations
This was the final push. We made one last attempt to recover the original 14,796 per-GPU throughput, and ended up beating it. Our best optimization now hits 15,057 tps. To achieve this, we implemented three optimizations and trained each for 5k steps to compare against torchtitan's default EP:
Three Optimizations
1. We wrote a Triton kernel to
directly fuse expert_output * router_probs (expert multiplication) with the SiLU
activations in the FFN [commit]
2. We wrote another Triton kernel to
fuse expert multiplication with scatter_add_ [commit]
3. We created a fork of DeepEP and modified it to trade a 50% increase in all-to-all communication volume for higher throughput by fusing the multiplication into DeepEP's combining kernel [our DeepEP fork].
We ended up not adding this to torchtitan because optimizations 1 and 2 were already good enough, and this would have required significant refactoring of the MoE modeling. We deprioritized it for now since it would take too much time, for marginal gain.
What We Learned
Looking back at this month of work, a few things stand out.
First: the bottlenecks are never where you expect them. We went in thinking GPU compute would be the key
constraint. Instead, we spent weeks debugging CPU launch overhead, kernel scaling behavior, and a
torch._grouped_mm edge case that only manifests when experts receive zero tokens.
Second: infrastructure work is underrated. There's a reason most labs don't talk about this stuff. It's not glamorous! But getting from "it runs" to "it runs at 57% of theoretical bandwidth" is the difference between a training run that finishes, and one that doesn't.
Third: the gap between papers and practice is real. DeepEP is cleverly designed, but the default
configurations weren't tuned for our hardware. The num_sms tuning alone gave us a 2x
improvement on crucial kernels. If you're adopting someone else's system, you will need to understand
and address the assumptions baked into their code.
Where We Landed
- 15,057 tokens/sec per GPU — up from 14,796 baseline
- 57% of theoretical NVLink bandwidth — up from DeepEP's baseline 34%
- Near-linear scaling to 128 GPUs
- Stable training — gradient norms and loss curves matching reference implementations
All of our optimizations are open source. You can dig through the code in our fork of torchtitan.
Questions? Feedback? If you're working on similar problems, or if you've solved one we're having trouble with, we would love to hear from you. Reach out on Twitter or Discord.